Core Web Vitals optimization is the process of improving three specific, measurable aspects of page experience - loading speed, interactivity, and visual stability - because Google uses them as a ranking signal and, more importantly, because they correlate directly with whether visitors stick around long enough to convert. I’ve worked Core Web Vitals fixes into a large in-house travel SEO program that drove 455,000 organic clicks, and the pattern held there as it does everywhere: vitals rarely make or break rankings on their own, but a failing score puts a ceiling on everything else you do, and fixing it removes friction that was quietly costing conversions long before anyone blamed “SEO.”
This guide covers what each metric actually measures, the fixes that move them in practice (not the generic “compress your images” advice that stops short of explaining why it matters), and a dedicated section for WordPress, since that’s where most site owners hit this problem first.
Does Core Web Vitals affect SEO?
Yes, but the effect is narrower than the anxiety around it suggests. Core Web Vitals are one of many signals in Google’s page experience assessment, and Google has been explicit that they function more as a tie-breaker between otherwise similar-quality pages than as a dominant ranking factor on their own. A page with poor vitals and outstanding, authoritative content will usually still outrank a page with perfect vitals and thin content.
Where vitals affect SEO indirectly, and often more significantly, is through user behavior: pages that load slowly or shift content around get abandoned faster, which depresses engagement signals and conversion rate regardless of whether Google penalizes the ranking directly. In the travel program referenced above, vitals work wasn’t chased for the ranking signal in isolation - it was justified by its effect on bounce rate and booking-flow completion on high-traffic pages, with the ranking benefit as a secondary outcome. That’s the right way to prioritize it: as a user-experience fix with an SEO side benefit, not the other way around.
Measure before you optimize
Before touching anything, know where your numbers actually stand and where the data comes from, because two very different data sources get conflated constantly:
- Field data (CrUX / GSC Core Web Vitals report) reflects real visitors on real connections over the past 28 days. This is what Google actually uses for the ranking signal, and it’s the number that matters for SEO purposes.
- Lab data (Lighthouse / PageSpeed Insights “lab data” section) simulates a single test run under controlled conditions. It’s useful for debugging why a page is slow, but it won’t always match field data, especially on sites with a wide range of real-world device and connection speeds.
Pull the GSC Core Web Vitals report first to see which URL groups are failing in the field, then use Lighthouse/PageSpeed Insights on representative pages from each failing group to diagnose the specific cause. Optimizing against lab data alone can produce a page that scores perfectly in a single test and still fails in the field for the actual mix of visitors you have.
LCP: Largest Contentful Paint
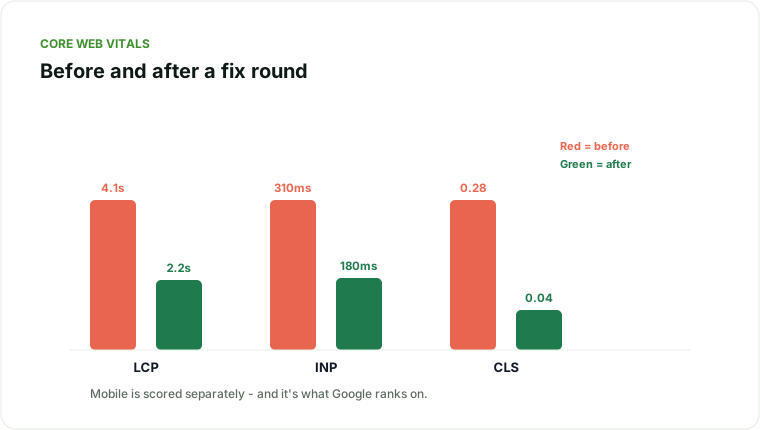
LCP measures how long it takes the largest visible element (usually a hero image, a large text block, or a video poster) to render. Google’s threshold for “good” is 2.5 seconds or under.
Common causes and fixes:
- Unoptimized hero images. Serve modern formats (WebP/AVIF), compress aggressively, and size images to their actual rendered dimensions rather than relying on the browser to scale down an oversized file.
- Render-blocking CSS/JS. Inline critical above-the-fold CSS and defer non-critical stylesheets and scripts so the browser can paint the main content before it finishes downloading everything else.
- Slow server response (TTFB). If the server itself takes over 600-800ms to respond before any rendering starts, no front-end optimization will fully compensate. Check hosting tier, enable server-side caching, and look for database queries running on every page load that could be cached or pre-computed.
- Late-discovered hero images. If the largest element is a background image set via CSS rather than an
<img>tag, the browser discovers it later in the loading sequence. Use<img>with afetchpriority="high"attribute for genuinely critical images, and preload the hero image in the document head. - Missing CDN. For image-heavy or global-audience sites, serving static assets from a CDN edge location close to the visitor is often the single highest-leverage LCP fix available.
INP: Interaction to Next Paint
INP replaced First Input Delay as the responsiveness metric and measures the delay between a user interaction (click, tap, key press) and the browser’s next visual update. Google’s “good” threshold is under 200ms.
Common causes and fixes:
- Heavy JavaScript execution on interaction. Audit what actually runs when a user clicks a menu, opens a filter, or submits a form. Long tasks blocking the main thread are the primary cause of poor INP - break them into smaller chunks or move them off the main thread with web workers where possible.
- Third-party scripts. Chat widgets, ad tags, and analytics scripts frequently run expensive work on interaction events they don’t need to. Audit tag manager containers specifically - it’s common to find scripts firing on every click site-wide that only needed to fire on one page.
- Unnecessarily large component re-renders. On JavaScript-framework-driven sites, a single interaction can trigger far more re-rendering than the visual change requires. This is a front-end engineering fix, not a marketing one, but it’s worth flagging to your dev team by name (INP, not “the site feels slow”) so it gets prioritized correctly.
- Input handlers doing synchronous work. Form validation, search-as-you-type, and similar handlers should debounce and avoid blocking work directly in the event handler.
CLS: Cumulative Layout Shift
CLS measures unexpected layout movement - the classic case is text you were about to tap shifting down as an ad loads above it. Google’s “good” threshold is under 0.1.
Common causes and fixes:
- Images and embeds without reserved dimensions. Always set explicit width/height (or
aspect-ratioin CSS) on images, iframes, and embeds so the browser reserves space before the asset loads. - Web fonts causing text reflow. A custom font swapping in after system-font text has already rendered shifts everything below it. Use
font-display: optionalor preload critical fonts, and size fallback fonts to closely match the final font’s metrics. - Ads and dynamically injected content. Reserve space for ad slots before the ad loads, rather than letting the ad script inject an element that pushes content down.
- Late-loading banners and cookie notices. These are a common, avoidable CLS source - reserve their space in the layout from initial render, don’t let them pop in and shove content.
WordPress Core Web Vitals: what’s different
WordPress sites hit a specific, repeatable set of vitals problems because of how plugins and themes stack:
- Plugin bloat. Every active plugin can add its own CSS/JS regardless of whether the current page uses its functionality. Audit plugins specifically for what they load site-wide versus what they load only where needed, and deactivate or replace anything loading unconditionally.
- Unoptimized theme image handling. Many themes still serve full-resolution uploads without responsive
srcsetmarkup. A caching/image-optimization plugin (or a CDN with automatic image optimization) closes this gap without a custom build process. - No page caching by default. A vanilla WordPress install regenerates every page dynamically on each request. A caching plugin or host-level full-page cache is close to a mandatory baseline fix, not an optional extra.
- Google Fonts loaded from Google’s CDN. This adds an extra DNS lookup and connection on top of your own server. Self-hosting fonts (several plugins do this automatically) or preconnecting to the font origin both help.
- Page builders generating excessive markup. Visual page builders (Elementor, Divi, and similar) are convenient but often generate deeply nested DOM structures and extra CSS that inflate both LCP and INP. This isn’t a reason to avoid them, but it is a reason to audit specific pages built with them rather than assume the builder itself is vitals-neutral.
A reasonable WordPress vitals baseline: a caching plugin, an image optimization plugin (or CDN with this built in), self-hosted or preconnected fonts, and a plugin audit removing anything not actively used. That combination resolves the majority of WordPress-specific vitals issues before any custom development work is needed.
Prioritizing fixes when you can’t do everything at once
Most teams don’t have unlimited engineering time to throw at vitals, so prioritize by where the traffic and the failure actually overlap:
- Start with your highest-traffic templates, not your worst scores. A rarely visited page scoring poorly matters far less than a template used by your top 20 landing pages scoring marginally poor. Group your Core Web Vitals report by URL pattern (template) rather than reviewing individual URLs one at a time.
- Fix LCP before INP before CLS, in most cases - LCP tends to have the most direct line to both bounce rate and the ranking signal, and it’s usually the cheapest to fix (image and server-response work) relative to INP fixes, which often require JavaScript engineering effort.
- Re-measure using field data 28 days after a fix ships, since CrUX data is a rolling 28-day window - checking a week after deployment will still be showing mostly pre-fix data.
- Don’t chase a perfect score. “Good” thresholds (LCP under 2.5s, INP under 200ms, CLS under 0.1) are the target - squeezing an already-passing metric further has rapidly diminishing returns compared to fixing a still-failing one elsewhere on the site.
Where Core Web Vitals optimization fits in the bigger picture
Vitals optimization is one section of a much larger technical health picture - it’s easy to over-invest engineering time chasing a perfect Lighthouse score while ignoring crawlability or indexation issues with a larger traffic impact. The technical SEO audit checklist covers where vitals sits relative to crawlability, architecture, structured data, and on-page fundamentals, and is the right starting point if you haven’t already scoped the full technical picture rather than just the vitals report.
If your Core Web Vitals report is red across the board and you’re not sure which fixes are worth the engineering time versus which are marginal, that’s exactly the prioritization a technical SEO audit is built to answer - measured against real traffic impact, not just a Lighthouse score.
Traffic sliding, or planning a risky migration?
I diagnose why organic traffic dropped and reverse it - core updates, migrations, cannibalization, technical decay.
Explore SEO recovery services